Brand constellation — 16 brands, sized by retail sales, ringed by licensees
Each node is a brand (area ∝ retail sales in the selected period). Dots on the ring are licensees; filled gold = every monthly sales report received, stone = late, hollow = missing. Hover a brand.
Royalty revenue — actual vs budget vs NSPB forecast
Monthly, Jan 2025 – Sep 2026 · $M recognised (actual royalties with GMR floor applied)
GMR vs actual royalties
Bullet per brand · stone band = guaranteed minimum · gold bar = actual earned royalty · tick = budget
Budget vs actual vs forecast
Royalty revenue $M · NSPB budget and latest forecast cycle
Licensee sales-reporting completeness
Monthly sales reports received per licensee · the input every royalty accrual depends on
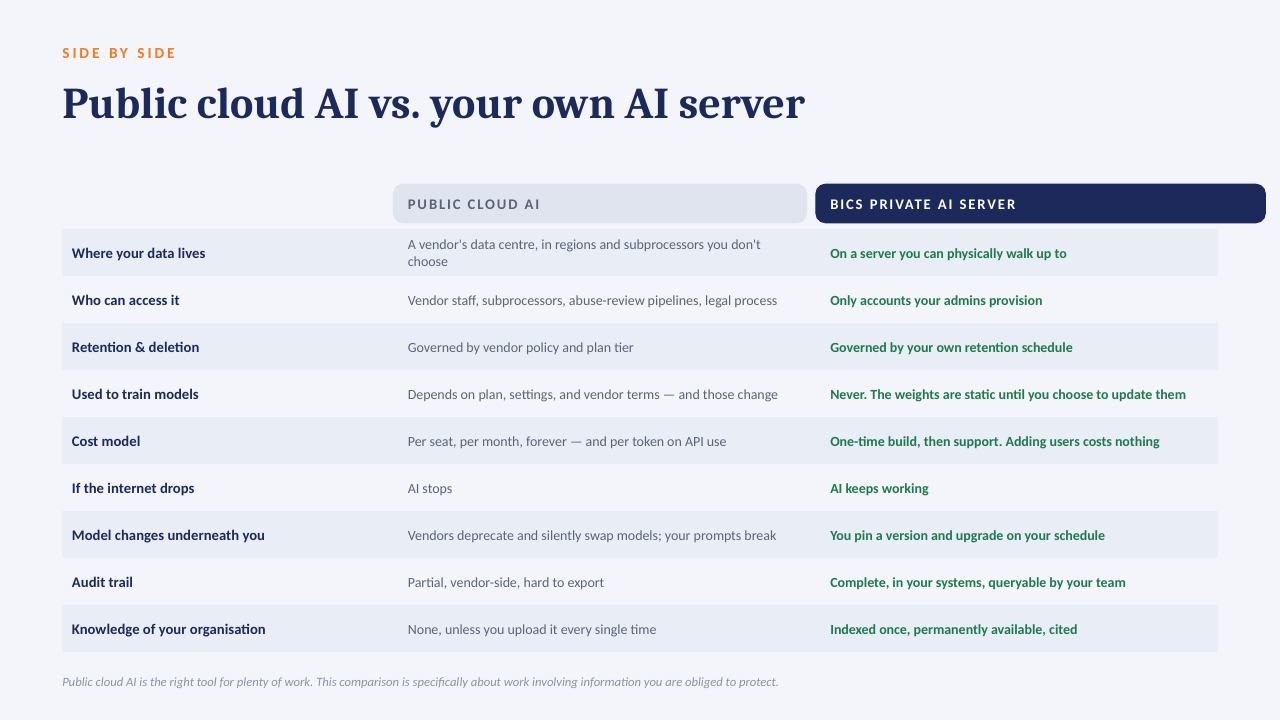
Territory mix
Retail sales and royalty by licensed territory
EBITDA bridge — budget to actual
$M · volume, rate & mix, GMR floor and operating-expense variances
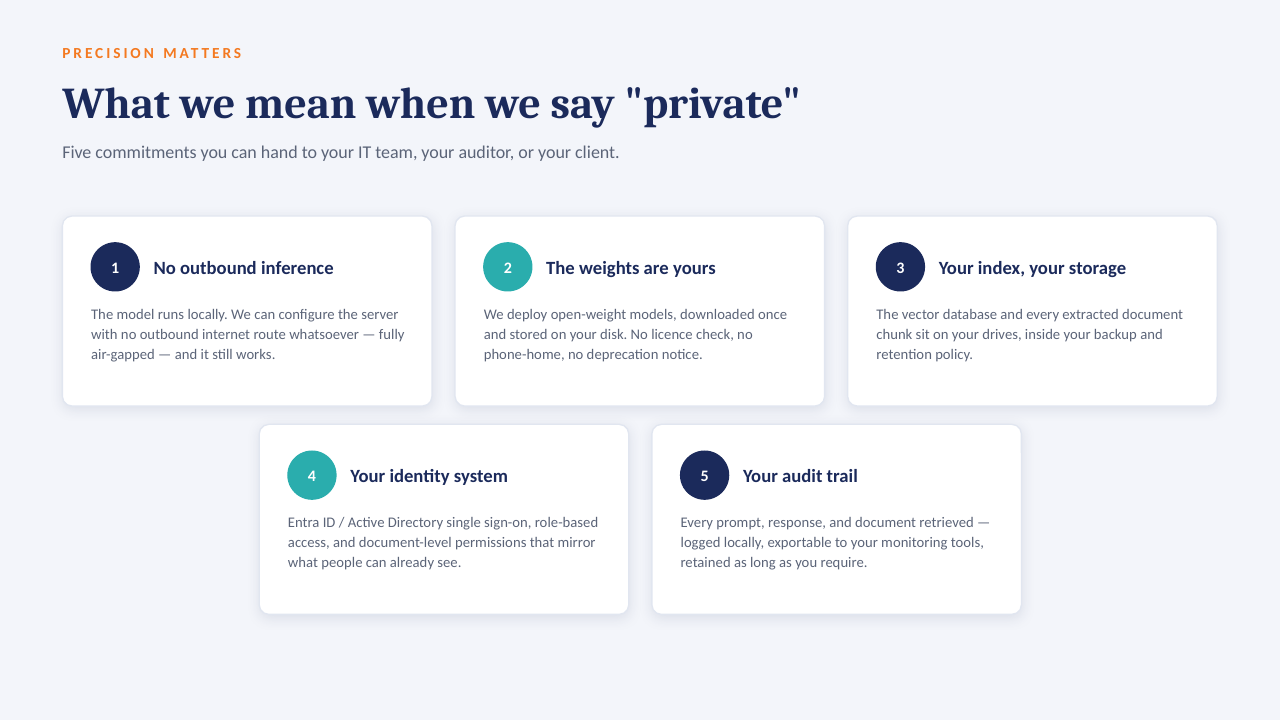
What this board answers
Three questions FP&A gets asked every close
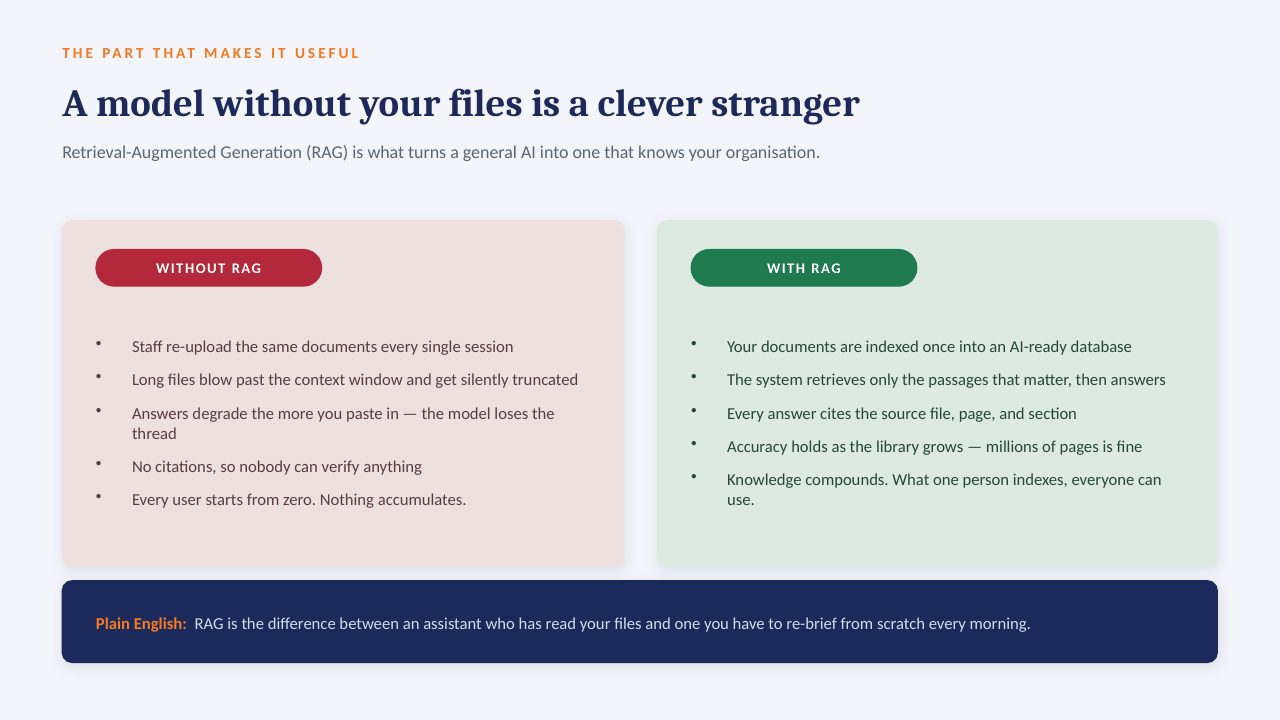
Ask the data
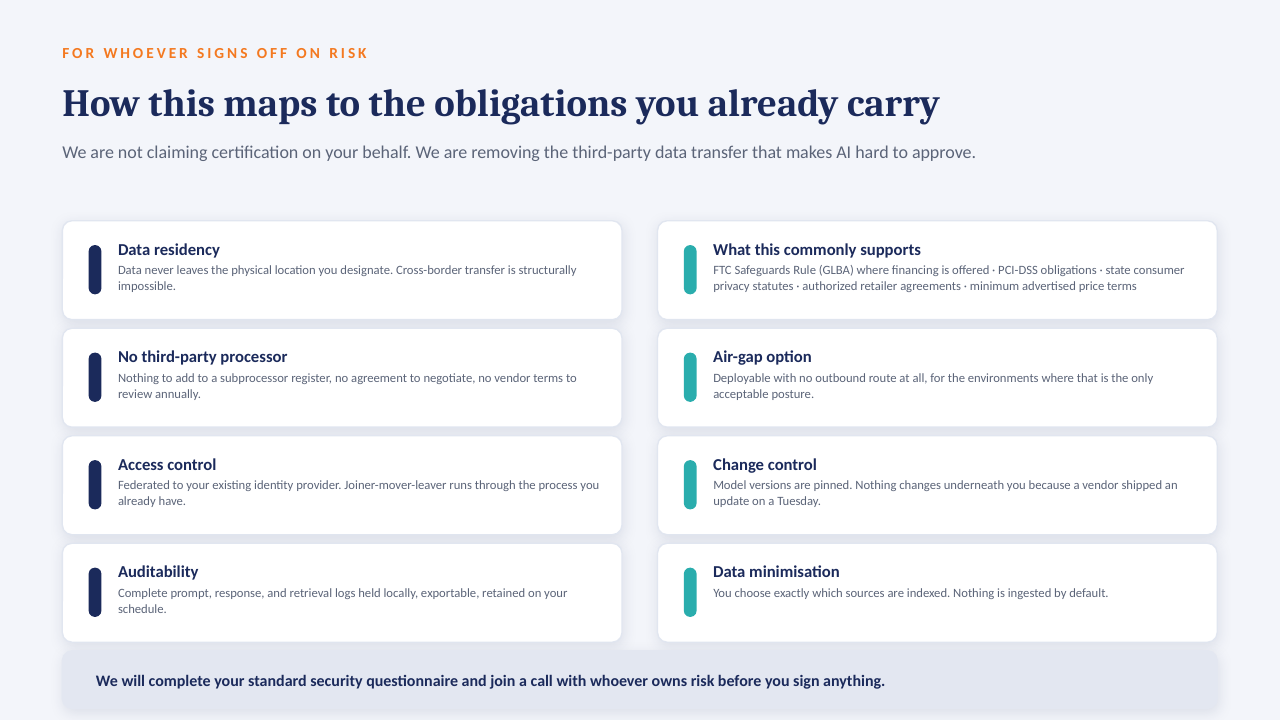
Natural-language layer over the same semantic model — answers inherit the viewer's row-level security
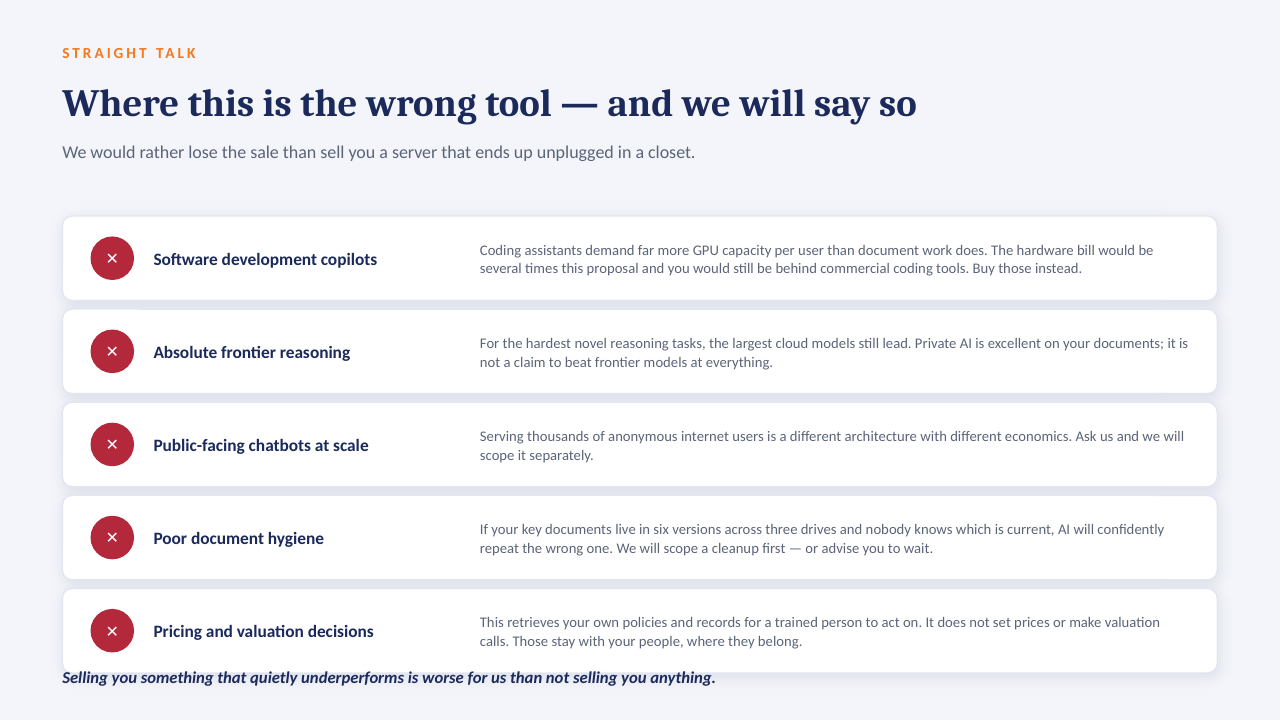
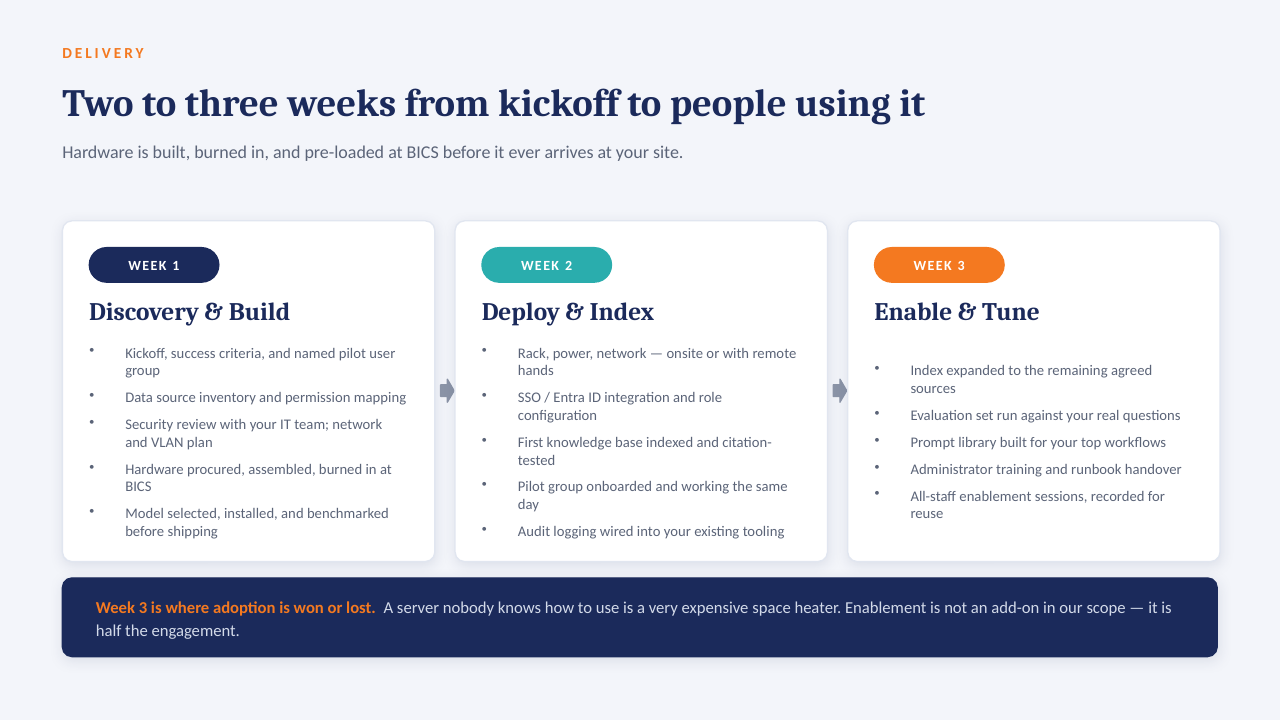
How it would be built — sized for 50–80 users, not for a data-platform bill
The three systems already in the building, landed once into a lake, modelled once, secured once.
Sources
- WestEnd — contracts, GMRs, licensee sales reports, royalty calcs
- NetSuite — GL, AR, invoicing, entities
- NSPB — budget, rolling forecast, driver models
Azure data lake · incremental
Scheduled extracts land as parquet; only changed months are reprocessed. One conformed brand / licensee / territory / period spine so every panel above reconciles to the same numbers.
Power BI semantic model + RLS
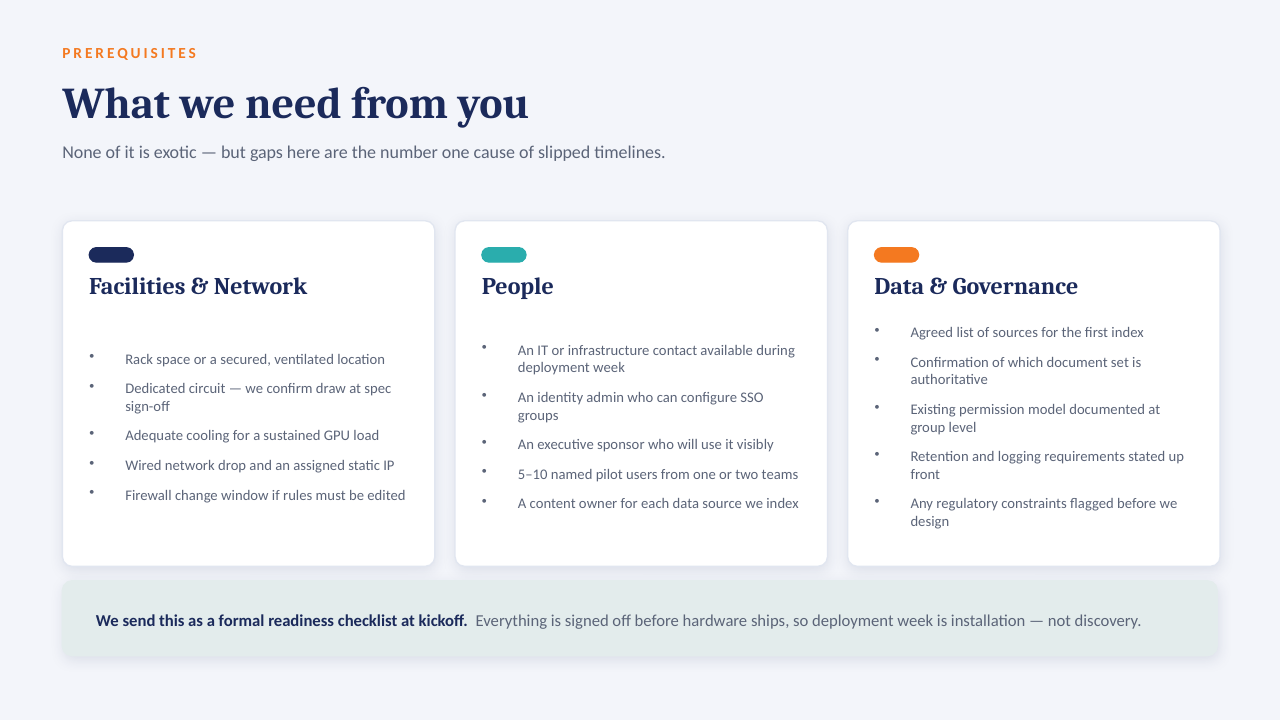
One model, three security roles (what you just switched between): CFO sees the portfolio, brand leads see their brands, licensees see only their own contract through a shared workspace app — no second model, no duplicate reports.